The State of Clean Energy | Renewable Energy
Are Greenhouse gases increasing?
Is global warming real or unreal - depending on who you talk to?
Is the EPA stepping back on many of the mission standards?
Will the world meet its zero emission goals?
Well, we don't know all the answers to all these concerns, but we definitely can lay down what else is going on in the world that will perhaps alleviate some of these concerns.
Renewables
Renewable energy is one of the fastest growing sources of electrical energy, but there are many challenges to harnessing these sources and integrating them to the grid seamlessly. Renewable energy sources have a common trait of not being depletable and can be naturally replenished. These sources include solar, wind, water, geothermal, biomass, ocean waves and currents.
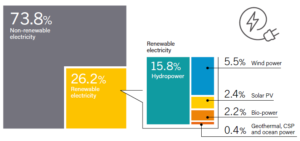
Renewables provided an estimated more than 26% of global electricity generation in 2018. In terms of new installed capacity, more renewable energy capacity is being installed globally than fossil fuels and nuclear combined - nearly 64% of net installation in 2018 were from renewable sources of energy.
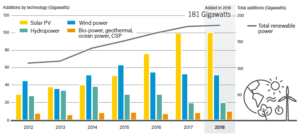
A total of about 181 gigawatts (GW) of new renewable power was added in 2018, with solar being the dominant technology:
| Solar Photovoltaics | 100 GW = 55% |
| Wind Power | 51 GW = 28% |
| Hyrdopower | 60 GW = 11% |
| Others
(Ethanol, Biodiesel, etc.) |
11 GW = 6% |
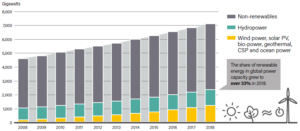
As shown below, the global power capacity of renewables now stands at around 2,378 GW at the end of 2018. However, in the areas of heating, cooling and transportation, renewables saw far less growth, primarily hindered by lack of progress in new policy development and by slow developments in new technologies.
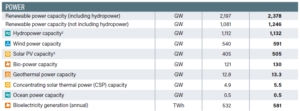
Source: GSR 2019 - page 19, Figure 1.0
A number of factors including lower costs for equipment, government policies and consumer/ corporate procurement demands are some of the reasons behind this preference for renewable energy. Electric power companies are beginning to adopt these new technologies to serve an increasing sophisticated customer base and corporations who in turn are beginning to demand choices in power sources that are environmentally responsible such as solar, wind and other renewable sources of energy. However, challenges remain including obtaining permits, right of way, environmental assessments, locations and seamless integration into the electric grid.
What is driving growth?
Some of the more fundamental reasons for this growth and interest include:
- Declining costs of solar PV and wind power equipment. Both these technologies have experienced steep declining cost curves and are able to compete with other conventional sources of energy. With advances in battery storage technology, the intermittency of wind and solar power generation has become less of an issue today, making both wind and solar power more reliable and on par in terms of cost and performance.
-
- The levelized cost of energy (LCOE) for land-based Wind power stands at about $30 - $60 USO per MWh.
- The LCOE for utility based Solar PV power stands at about$43 - $53 USO per MWh.
- The LCOE for Natural gas (CCGT combined cycle) which stands at about $42 - $78 per MWh.
-
- Advances in battery technology and Distributed Energy Storage (DER) is making it all more possible to store access energy in storage batteries and mitigate the intermittencies of solar and wind power. Solar plus storage projects are now a common occurrence. State and Federal policies and mandates on battery development and storage are also enabling the growth of renewable energy e.g. FERC 841 which mandated grid owners to remove all barriers to electric storage.
- Increasing expertise and experience of the utilities in connecting the excess power into to the grid. Frankly, the issue of incompatibilities between renewable energy sources such as solar or wind and its integration into the smart grid is much overblown. It is not all that difficult for this integration to happen and in fact, it is happening today.
- Government policies that favor renewable energy growth. New policies at all levels of government - local, state and federal will likely enable more growth in the years to come. More and more states are putting in mandates (renewable portfolio standards - RPS) and targets for increase in renewable energy in the energy mix.
- Increasing interest from private investors looking for profits in the renewable energy sector. The larger oil and gas companies are also taking a renewed interest and investing in renewable energy sources, driven partly by the falling equipment costs, social and environmental responsibility and public awareness of climate change issues.
- Increasing demand from corporation and consumers alike for renewable energy sources - voluntary demand as opposed to policy mandates. Corporation are also continuing to buy increasing amounts of renewable energy as part of their sustainability goals and carbon reduction programs.
- Cities account for about 75% of global carbon emissions and 65% of the global demand. As such, city programs are also contributing and adding value to renewables. In an effort to curb CO2 emissions and address clean air, major cities around the world are adopting ambitious targets and implementing a number of programs in renewable energy serving economic, social public health and environmental goals. By end of 2018, more than 230 cities around the world had adopted target of 100% renewables in one or more segments.
Solar Power
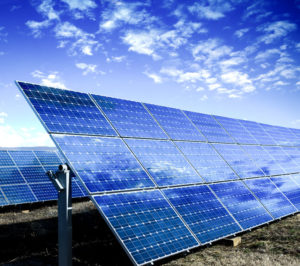 By the end of 2018, five countries had installed 350 GW of power out of the total 505 GW gobally - that's almost 70%! These countries are China, the USA, Japan, Germany, and India.
The general consensus is that solar power will continue its upward trend in the electric energy mix. The countries leading this charge in solar power installation are China, USA, Japan, Germany and India. Together these five countries had installed by end of 2018, about 350 GW of power out of the total of 505 GW globally - almost 70%.
Solar photovoltaics panels are getting cheaper. In fact, this downward trend has been continuing for some time now. In 2018, new solar installed capacity accounted for fifty-five percent of all renewable installed capacity combined. Now, that is excellent news for our industry!
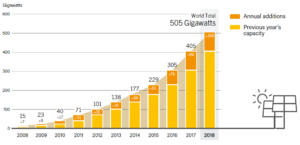
Source: GSR 2019 - Becquerel Institute and IEA PVPS, Figure 25.0
Apart from utility-based solar installations, many private corporations in mining, manufacturing and other industries have been installing their own private solar farms for internal consumption. By end of 2018, about 32 countries had installed solar capacity of more than 1 GW.
Wind Power - Renewables
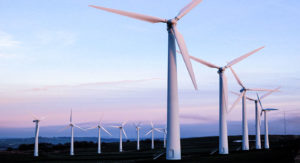
Most of the installed capacity has been land-based or onshore capacity. However, interest in off-shore installations is beginning to grow, especially after the success noted in Europe. In 2018, about 51 GW representing about 28% of newly installed renewable capacity was wind power based. This now represents about 591 GW or 25% of the total cumulative capacity of renewable energy at the end of 2018. Wind power technology is also advancing at a rapid rate, with larger turbines increasing the production and efficiency. More than 103 countries have commercial wind power capacity and more than 33 countries have more than 1 GW in operation at the end of 2018. Again, China, USA, Japan, Germany and India are leading the charge in terms of installed wind power.
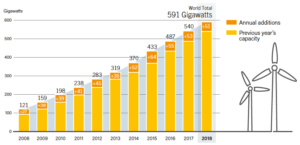
Source: GSR 2019 - GWEC, Figure 35.0
Mix of Renewables
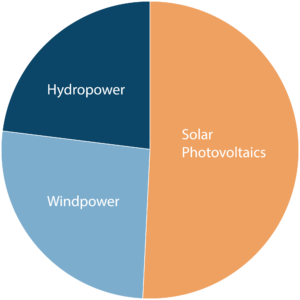
At the end of 2018, in terms of total existing and newly installed capacity, we saw the following:
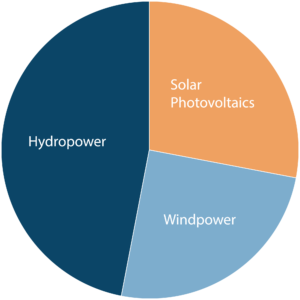
Existing Installed Capacity
Hydropower 47%
Wind power 28%
Solar Photovoltaics 25%
Newly Installed Capacity
Hydropower 23%
Wind power 26%
Solar Photovoltaics 51%
Conclusion: Solar energy is increasing at a more rapid pace than other sources of renewable energy.
Source: GSR 2019 - Figure 6.0
Source: GSR 2019 - Figure 7.0
Source: GSR 2019 - Figure 8.0
Distributed Sources of Renewable Energy
Distributed sources of renewables are defined as those systems that are used for personal or standalone purposes. Generally, these systems are of the grid. Most of these standalone systems are installed in developing countries and are used for multiple purpose such as lighting, cooking and heating. It is estimated that between 100-150 million people across the globe use these systems.
Electric Vehicles
It is estimated that in 2018, there were about 5.1 M electric cars and 260 M electric two wheelers on the road. As Electric vehicles become more and more common, the demand for energy and consequently clean energy will increase. Charging stations using solar powered technology will become a common sight. It is estimated that more than 100,000 public EV charging station were installed in 2018 across the world. Again China, USA, Netherlands, Japan and France were leading the charge.
Jobs in the Renewable Sector
The renewable sector employed around 10-11 million people globally in 2018. Solar PV still creates more jobs as it is more labor intensive - an estimated 3.5 million jobs globally.
Energy Consumption
While renewables are about 26% of the global electricity generation, they represent only about 10% when used for heating and cooling and only about 3% when we look at transportation. Keep in mind that heating and cooling uses natural gas and oil while the transportation industry is till using mostly gasoline and diesel.
Conclusion - Renewables
Despite all the progress in renewables and other energy-efficient technologies, the targets set forth in the Paris Agreement are not being met. CO2 emission grew slightly in 2018 due to increase in fossil fuel consumption. Government subsidies for fossil fuel also grew by 11 % in 2017. Progress in renewables is slowed due to fossil fuel subsidies and lack of policies and standards in many countries of the world.
But, for every bit of bad news there is some good news and progress is being made. Many countries have put in place targets for renewable energy. Costs will continue to drop, and new technologies will come into place. The growth drivers will continue to run their course. By end of 2018, over 90 countries had installed some generating capacity (> 1 GW) based on renewables. Progress may seem slow, but it is happening.
In conclusion here are some facts to ponder upon:
- Renewable energy targets are in place is almost all countries in the world and policies tending to support renewable energy are increasing
- Renewable energy is now considered "Mainstream" source of energy
- The estimated share of renewables in global electricity generation was about 26% by the end of 2018
- In terms of new installed capacity, more renewable energy capacity is being installed globally than fossil fuels and nuclear combined - nearly 64% of net installation in 2018 were from renewable sources of energy.
- The Levelized Cost of Energy (LCOE) for renewable is less than that of fossil-based fuels - making renewable energy very cost competitive.
References:
- Global renewable energy trends; Deloitte Insights
- US Dept of Energy-various sources
- EIA -various sources
- IRENA-various sources
- Renewable Global Status Report -GSR 2019
Alnoor Ebrahim | Marketing Strategy Development
Jordan Ponizhaylo | Marketing Specialist